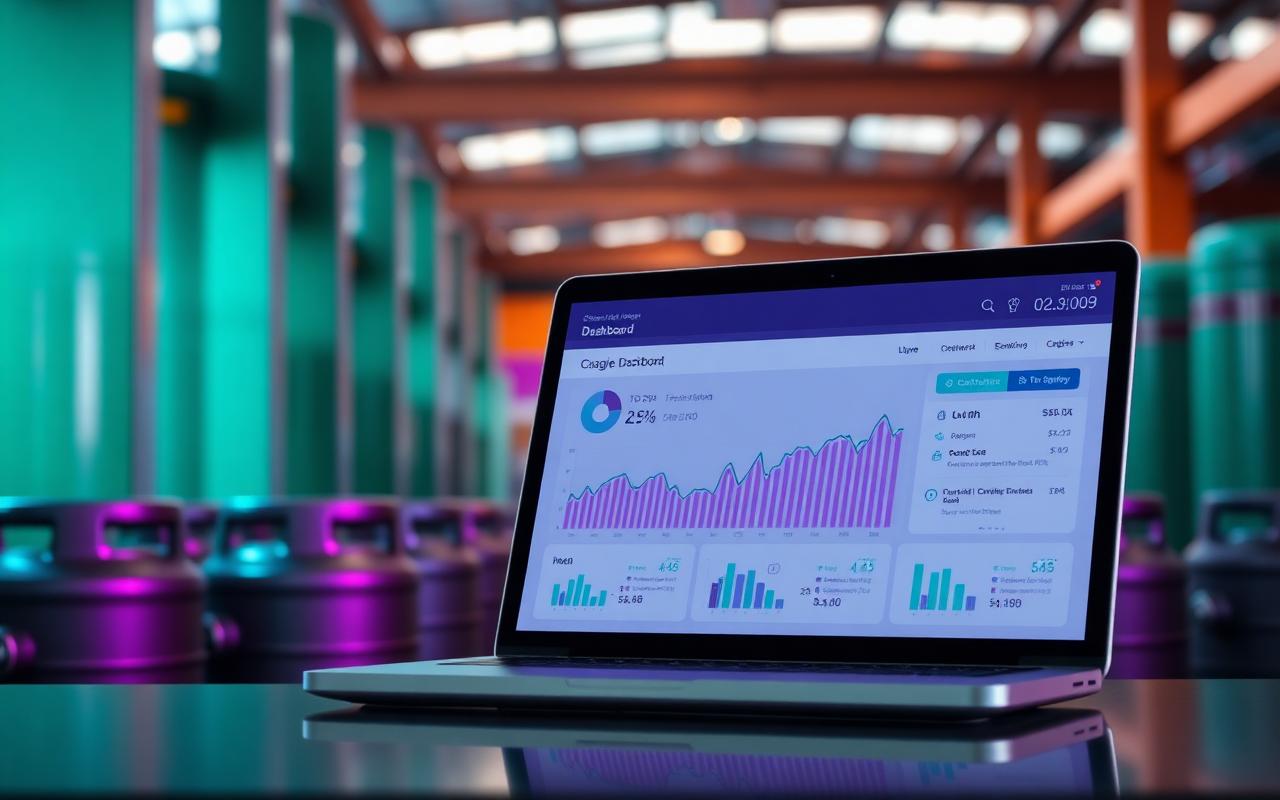
The ROI of Cylinder Tracking: How to Calculate Real Savings
Every gas business intuitively knows that untracked cylinders cost money — cylinders that vanish, demurrage that never gets billed, hours lost to manual reconciliation. But intuition does not get a capital project approved. What gets a project approved is a clear, defensible ROI case that a finance director can interrogate line by line and still sign off on. This guide breaks the return on investment of cylinder tracking into measurable levers, walks through a realistic worked example, and gives you a framework to build your own numbers before you ever talk to a vendor.
Why ROI conversations on cylinder tracking usually go wrong
The most common mistake operators make is presenting cylinder tracking as a cost-saving IT project rather than a revenue-and-asset-recovery investment. Framed as "software that will help us track cylinders better," it competes for budget against every other IT wishlist item and usually loses. Framed correctly — as "a project that recovers ₹X lakh of currently lost cylinder value and captures ₹Y lakh of currently unbilled demurrage every year" — it becomes one of the highest-return capital allocations available to a gas distribution business, often outperforming a new delivery truck or a plant efficiency upgrade in payback terms.
The reason this reframing matters is that cylinder loss and demurrage leakage are largely invisible in a standard P&L. They do not appear as a labelled expense line; they are absorbed into "cost of goods sold" as higher-than-expected cylinder purchases, and into "revenue" as simply lower-than-it-should-be. An ROI model makes the invisible visible.
Lever 1: Recovered cylinder losses
The single biggest number in almost every ROI model is shrinkage — cylinders that are filled, dispatched, and never seen again, whether through customer non-return, theft, misplacement between depots, or simple record-keeping failure.
Consider a mid-sized distributor that owns 20,000 cylinders with an average replacement cost of ₹6,000. If that fleet quietly loses 3% each year — a figure that is unremarkable for an unmanaged operation — that is 600 cylinders and ₹36 lakh lost annually, every year, compounding as the fleet grows. A tracking system that cuts loss by even half, a conservative outcome once every handoff is scanned and every customer holding is tied to a named ledger entry, returns ₹18 lakh in year one alone. Well-run implementations often do considerably better than half, because most of the loss in an unmanaged fleet is concentrated in a small number of easily-closed channels — see our cylinder loss reduction checklist for the specific gaps that usually account for the bulk of shrinkage.
Lever 2: Demurrage and rental capture
Cylinders sitting at customer sites past their agreed free days are billable — but only if you can prove exactly when they arrived, and only if someone is actually reviewing the overdue list. In a manual operation, this tracking is either not done at all or done so inconsistently that most operators simply write off demurrage as uncollectable.
Automated holding-period tracking flips this entirely: every scan-based delivery starts a timer, every scan-based return stops it, and demurrage is calculated and invoiced without anyone having to remember to check. Distributors who implement this consistently often discover a demurrage recovery equal to 1–3% of annual rental revenue that was previously simply invisible. For a business billing ₹10 crore a year in cylinder rental, that is ₹10–30 lakh of found revenue that required no new customers, no new cylinders and no new sales effort — purely better capture of money already owed. Read more in our detailed breakdown of cylinder deposit and demurrage management.
Lever 3: Labour and administrative savings
Manual ledgers, end-of-day reconciliations, and dispatch paperwork consume real hours every single day across filling staff, dispatch clerks, accounts teams and depot supervisors. Scan-based workflows typically cut administrative time by 40–60%, not by eliminating jobs but by eliminating the repetitive, error-prone transcription that currently fills a large share of the working day.
To put a number on this: if a distributor employs the equivalent of three full-time staff whose primary function is manual reconciliation, challan entry and stock verification, at a fully loaded cost of ₹35,000 per month each, that is ₹12.6 lakh a year in labour that a 50% efficiency gain could redeploy toward customer service, sales support or route optimisation — work that grows the business rather than just keeping the books straight.
Lever 4: Faster, more accurate billing
When every dispatch and return is captured digitally at the point of the transaction, invoices can go out the same day rather than waiting for a batch reconciliation at month-end. Faster billing shortens your cash-conversion cycle in a way that is easy to underestimate: shaving even five days off your average invoice-to-payment cycle on a ₹10 crore annual rental book is the equivalent of freeing up roughly ₹14 lakh of working capital that would otherwise sit uncollected.
Billing accuracy compounds this benefit. Manual billing errors — wrong quantities, wrong customer, wrong holding period — generate disputes, and disputes delay payment far longer than the original invoicing lag. A system where every invoice line traces back to a scanned event is very difficult for a customer to credibly dispute, which in practice means fewer stalled receivables and a healthier debtor book.
Lever 5: Compliance and safety risk
Missed hydrostatic tests, expired certifications, and audit failures carry real financial and reputational cost — regulatory penalties, insurance complications, and in the worst cases, safety incidents that can shut down an entire operation. This is genuinely difficult to price into a simple ROI spreadsheet because the downside is a tail risk rather than a predictable annual cost, but it deserves a place in the model as a risk-adjusted line item.
A reasonable approach is to estimate the probability-weighted cost of a single serious compliance failure — regulatory fine, forced fleet inspection, reputational damage with a major customer — and treat automated due-date tracking through a cylinder compliance solution as insurance against that event, at a cost far lower than the risk it removes.
Lever 6: Better capital planning
A less obvious benefit: accurate, real-time visibility into how many cylinders you actually have, where they are, and how fast they are turning, dramatically improves fleet capital planning. Distributors without tracking often over-buy cylinders "just in case" because they cannot trust their own stock numbers, tying up capital in redundant cylinders that a tighter, trusted inventory system would have made unnecessary. Analytics-driven insight into cylinder inventory turnover frequently reveals that a fleet can serve the same customer base with 10–15% fewer cylinders once true circulation velocity is understood.
A worked example, put together
| Lever | Annual impact (illustrative, 20,000-cylinder fleet) |
|---|---|
| --- | --- |
| Recovered cylinder losses | ₹18,00,000 |
| Demurrage capture | ₹15,00,000 |
| Labour and admin savings | ₹6,30,000 |
| Faster billing (working capital equivalent) | ₹14,00,000 |
| Compliance risk reduction | Not quantified (risk-adjusted) |
| Total measurable annual benefit | ₹53,30,000 |
Against this, a typical GCT-class deployment across a fleet of this size — software licensing, tagging hardware, mobile devices for drivers, and implementation — commonly falls in the range of ₹15–30 lakh depending on scope and whether RFID or simpler barcode/QR tagging is used.
A simple payback formula
Payback (months) = System cost ÷ (Monthly recovered loss + demurrage + labour savings)
Using the worked numbers above — roughly ₹4.4 lakh of monthly measurable benefit against a ₹20 lakh implementation — payback lands under five months. Even allowing for a conservative ramp-up period, where benefits build gradually over the first two to three quarters as scanning discipline embeds across the organisation, most operators reach full payback within 6–12 months of go-live.
Building your own ROI model in five steps
- Pull your fleet size and replacement cost. Total active cylinders multiplied by average unit replacement cost gives you the asset base at risk.
- Estimate current loss rate honestly. If you have never measured this precisely, use your last physical stock count versus book records as a proxy, or benchmark against the 3–6% typical of unmanaged fleets.
- Quantify unbilled demurrage. Sample a month of customer holding data manually — even a rough estimate of average overdue days across your top 20 customers will reveal a meaningful number.
- Cost your current administrative burden. Time-track (even informally, for one week) how many staff-hours go into manual challans, reconciliation and stock verification.
- Model three scenarios — conservative, expected, optimistic — rather than a single number, so the business case survives scrutiny from a sceptical finance reviewer.
Frequently asked questions
How quickly do most gas companies see ROI after implementing cylinder tracking? Most operators reach payback within 6–12 months, with the loss-reduction and demurrage-capture levers typically showing measurable results within the first 90 days of consistent scanning discipline.
Does ROI differ between industrial gas, medical gas and LPG operators? Yes — medical gas operators often see a larger share of ROI from compliance risk reduction given stricter regulatory scrutiny, while LPG and industrial gas distributors typically see the larger share from loss reduction and demurrage capture due to higher cylinder circulation volumes.
Is RFID worth the extra cost over barcode/QR for ROI purposes? It depends on volume and handling patterns. High-throughput gate and warehouse operations often recoup the higher RFID hardware cost quickly through labour savings on bulk scanning; lower-volume operations frequently get comparable ROI from simpler QR or barcode tagging at a fraction of the upfront cost.
What is the biggest risk to achieving projected ROI? Inconsistent scanning discipline in the first few months. The financial model assumes every handoff is actually scanned — partial adoption delivers partial returns, which is why implementation support and staff training matter as much as the software itself.
Modelling your own numbers
Every one of these levers scales with your actual fleet size, loss rate and rental revenue — which is exactly why a generic industry average is a poor substitute for running your own figures. Try our ROI calculator to plug in your fleet size, replacement cost and current loss estimate and see a payback timeline built around your business specifically, or book a demo to walk through the model with our team using your actual operational data. You may also want to read why gas companies lose cylinders for a deeper look at where the loss-side numbers actually come from.
Explore related GCT software
Put the ideas in this article into practice with the GCT modules and technologies built for it.
Run a smarter cylinder fleet with GCT
GCT gives gas companies barcode, QR & RFID tracking, automated billing, compliance dashboards and a mobile field app — all in one platform.
Running an enterprise gas distribution operation? Explore the Cylinder Tracking Management System at ctmsgas.com for enterprise-grade cylinder ERP deployments.