Data Analytics & BI
Data analytics and business intelligence (BI) turn the raw stream of cylinder movements into clear answers — how many cylinders you are losing, how well they are utilised, and where money is leaking.
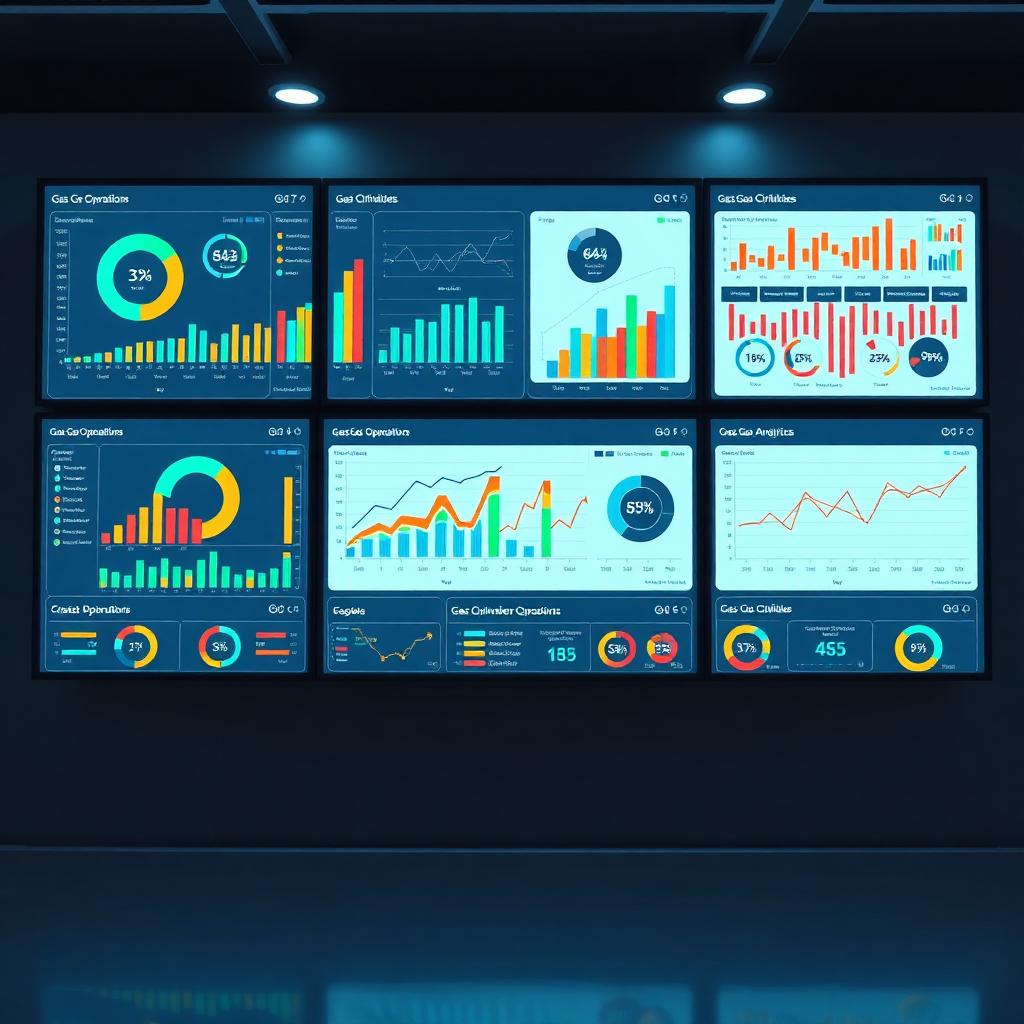
Live dashboards surface the KPIs that matter: loss rates, cylinder turnaround time, utilisation, demurrage recovery and demand trends, all from the data GCT already captures.
With BI, cylinder management stops being a monthly guess and becomes a set of measured, improvable numbers the whole business can act on.

Key benefits
Measure losses
Quantify shrinkage and pinpoint where and when cylinders go missing.
Improve utilisation
See idle vs active cylinders and rebalance to sweat your assets harder.
Track KPIs live
Turnaround, demurrage recovery and demand trends update in real time.
Confident decisions
Plan purchasing, staffing and pricing on evidence, not intuition.
What's included
- Live KPI and MIS dashboards
- Loss, utilisation and turnaround analytics
- Demand and seasonality trends
- Customer and branch performance views
- Custom reports and data export
- Drill-down from summary to cylinder level
Frequently asked questions
What insights can analytics give me?
Loss rates, cylinder utilisation, turnaround times, demurrage recovery, demand trends and customer/branch performance — all from your tracking data.
Do I need a data team to use it?
No, BI dashboards present the key metrics visually; you can drill down without writing queries.
Can I export or build custom reports?
Yes, you can create custom reports and export data for deeper analysis.
How does this reduce losses?
By measuring exactly where and when cylinders go missing, analytics lets you target the processes causing shrinkage.
Ready to gain full control of every cylinder?
Book a personalized GCT demo and see how leading gas companies eliminate cylinder losses.